18 AR(1) Model
A univariate time series is a sequence of measurements of the same variable collected over time. Most often, the measurements are made at regular time intervals.
One defining characteristic of a time series is that it is a list of observations where the ordering matters. Ordering is very important because there is dependency and changing the order could change the meaning of the data.
Some important questions to first consider when first looking at a time series are:
- Is there a trend, meaning that, on average, the measurements tend to increase (or decrease) over time?
- Is there seasonality, meaning that there is a regularly repeating pattern of highs and lows related to calendar time such as seasons, quarters, months, days of the week, and so on?
- Are there outliers? In regression, outliers are far away from your line. With time series data, your outliers are far away from your other data.
- Is there a long-run cycle or period unrelated to seasonality factors?
- Is there constant variance over time, or is the variance non-constant?
- Are there any abrupt changes to either the level of the series or the variance?
The following plot is a time series plot of the annual number of earthquakes in the world with seismic magnitude over 7.0, for 99 consecutive years.
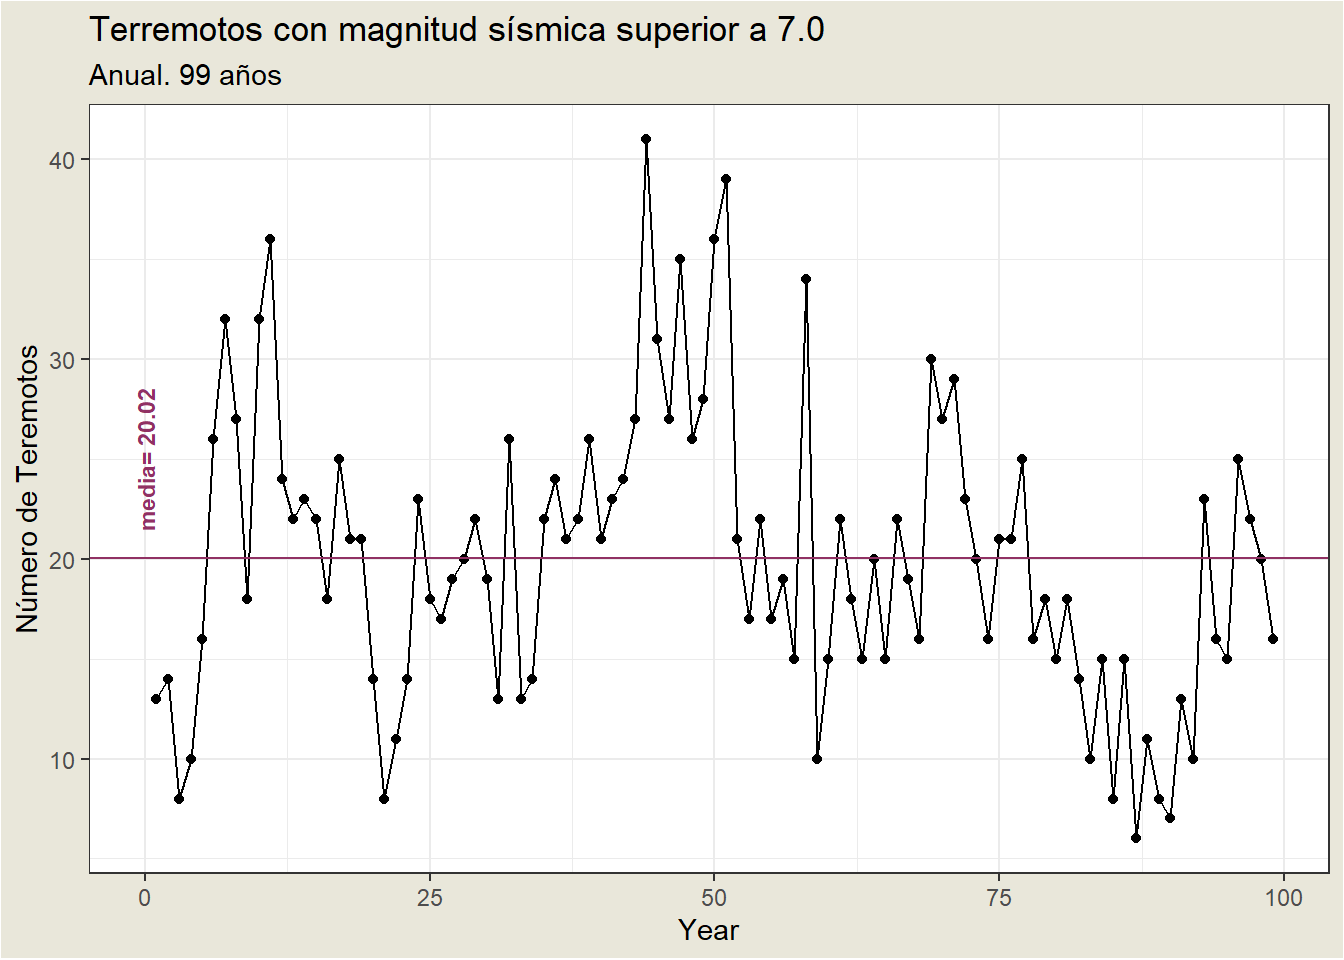
Some features of the time series plot3:
- There is no consistent trend (upward or downward) over the entire time span. The series appears to slowly wander up and down. The horizontal line drawn at quakes = 20.2 indicates the mean of the series. Notice that the series tends to stay on the same side of the mean (above or below) for a while and then wanders to the other side.
- Almost by definition, there is no seasonality as the data are annual data.
- There are no obvious outliers.
- It is difficult to judge whether the variance is constant or not.
One of the simplest ARIMA type models is a model in which we use a linear model to predict the value at the present time using the value at the previous time. This is called an AR(1) model, standing for autoregressive model of order 1. The order of the model indicates how many previous times we use to predict the present time.
A start in evaluating whether an AR(1) might work is to plot values of the series against lag 1 values of the series: \(y_t\) vs $y_{t_{1}}.
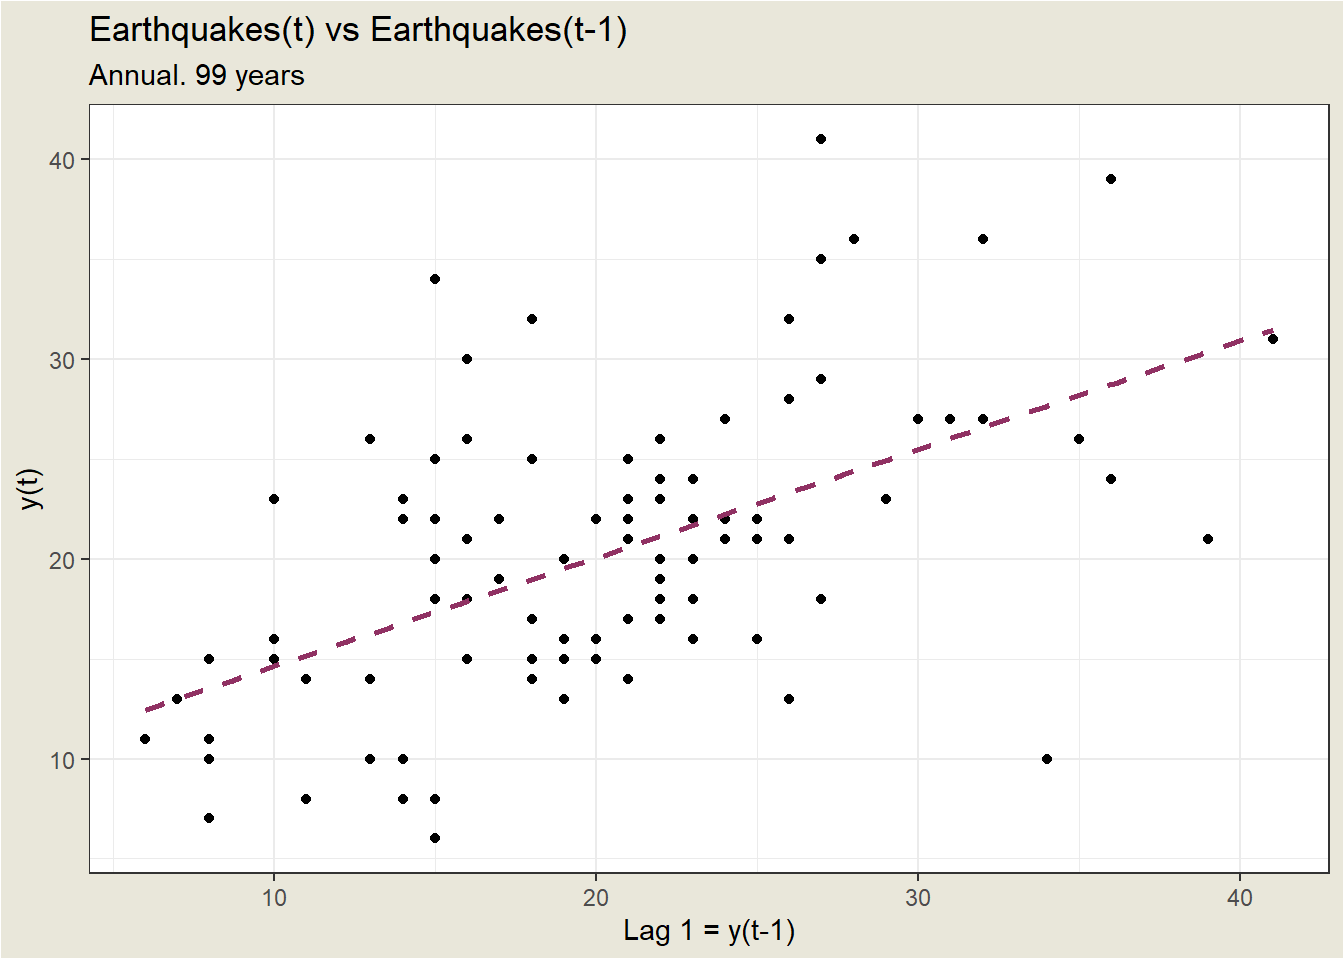
Although it’s only a moderately strong relationship, there is a positive linear association so an AR(1) model might be a useful model.
By a time series plot, we simply mean that the variable is plotted against time.↩︎