9.1 Confusion Matrix
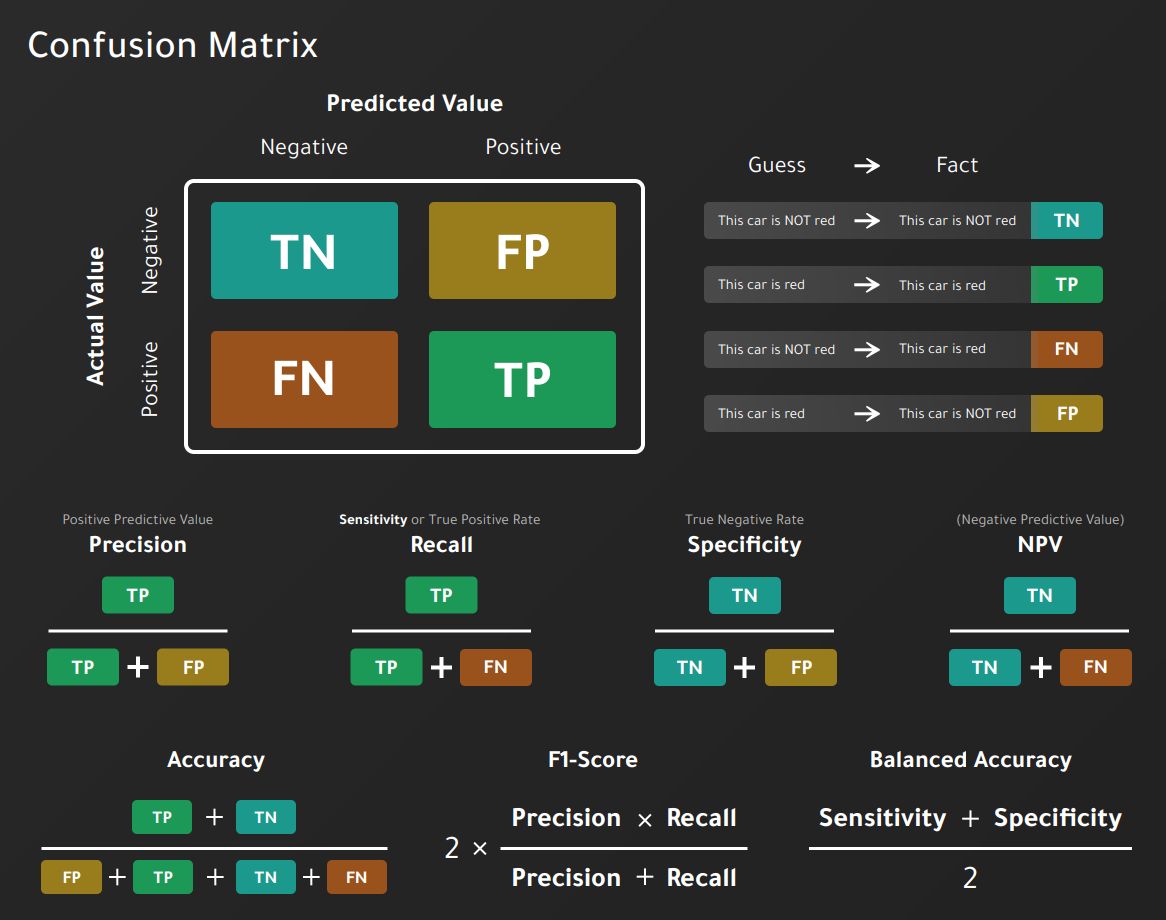
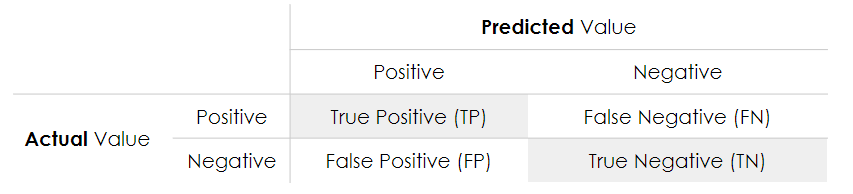
The confusion matrix shows the number of correct and incorrect predictions made by the model compared to the actual results in the data. The confusion matrix is a matrix \(n\)times n$, where \(n\) is the number of classes.
In our example:
- Accuracy: the proportion of the total number of correct predictions.
\[ACC = \frac{TP+TN}{TP+TN+FP+FN}\]
- Positive Predictive Value: the proportion of positive cases that were correctly identified.
\[PPV = \frac{TP}{TP+FP}\]
- Negative Predictive Value: the proportion of negative cases that were correctly identified.
\[ NPV = \frac{TN}{TN+FN} \]
- Sensitivity or Recall: lhe proportion of actual positive cases that are correctly identified.
\[TPR = \frac{TP}{TP+FN}\]
- Specificity: the proportion of real negative cases that are correctly identified.
\[TNR = \frac{TN}{TN+FP}\]
## Confusion Matrix and Statistics
##
##           Reference
## Prediction No Yes
##        No  15  20
##        Yes  5  60
##
##                Accuracy : 0.75
##                  95% CI : (0.6534, 0.8312)
##     No Information Rate : 0.8
##     P-Value [Acc > NIR] : 0.91252
##
##                   Kappa : 0.3902
##
##  Mcnemar's Test P-Value : 0.00511
##
##             Sensitivity : 0.7500
##             Specificity : 0.7500
##          Pos Pred Value : 0.9231
##          Neg Pred Value : 0.4286
##              Prevalence : 0.8000
##          Detection Rate : 0.6000
##    Detection Prevalence : 0.6500
##       Balanced Accuracy : 0.7500
##
##        'Positive' Class : Yes
##