Examples
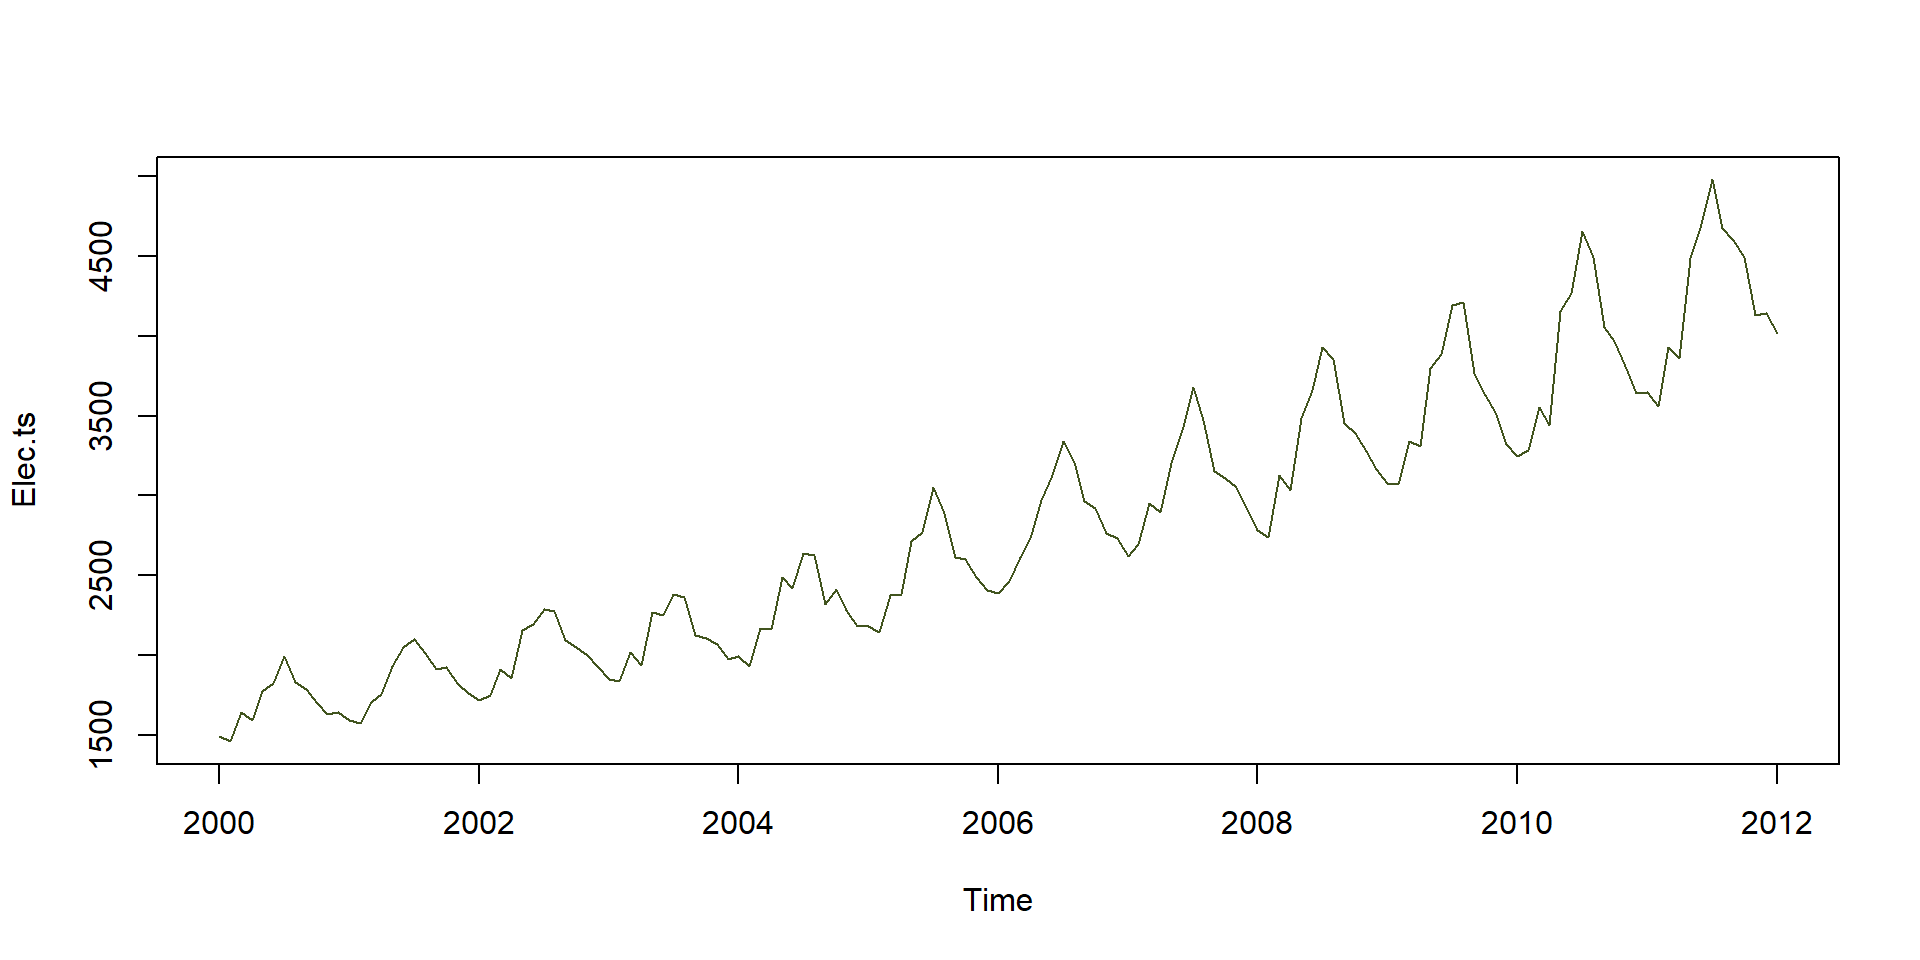
- In this first graph we show the electricity consumption of a population between 2000 and 2012.
- It can be seen that there is a clear growth trend and a cyclical pattern that defines the series every 12 months.
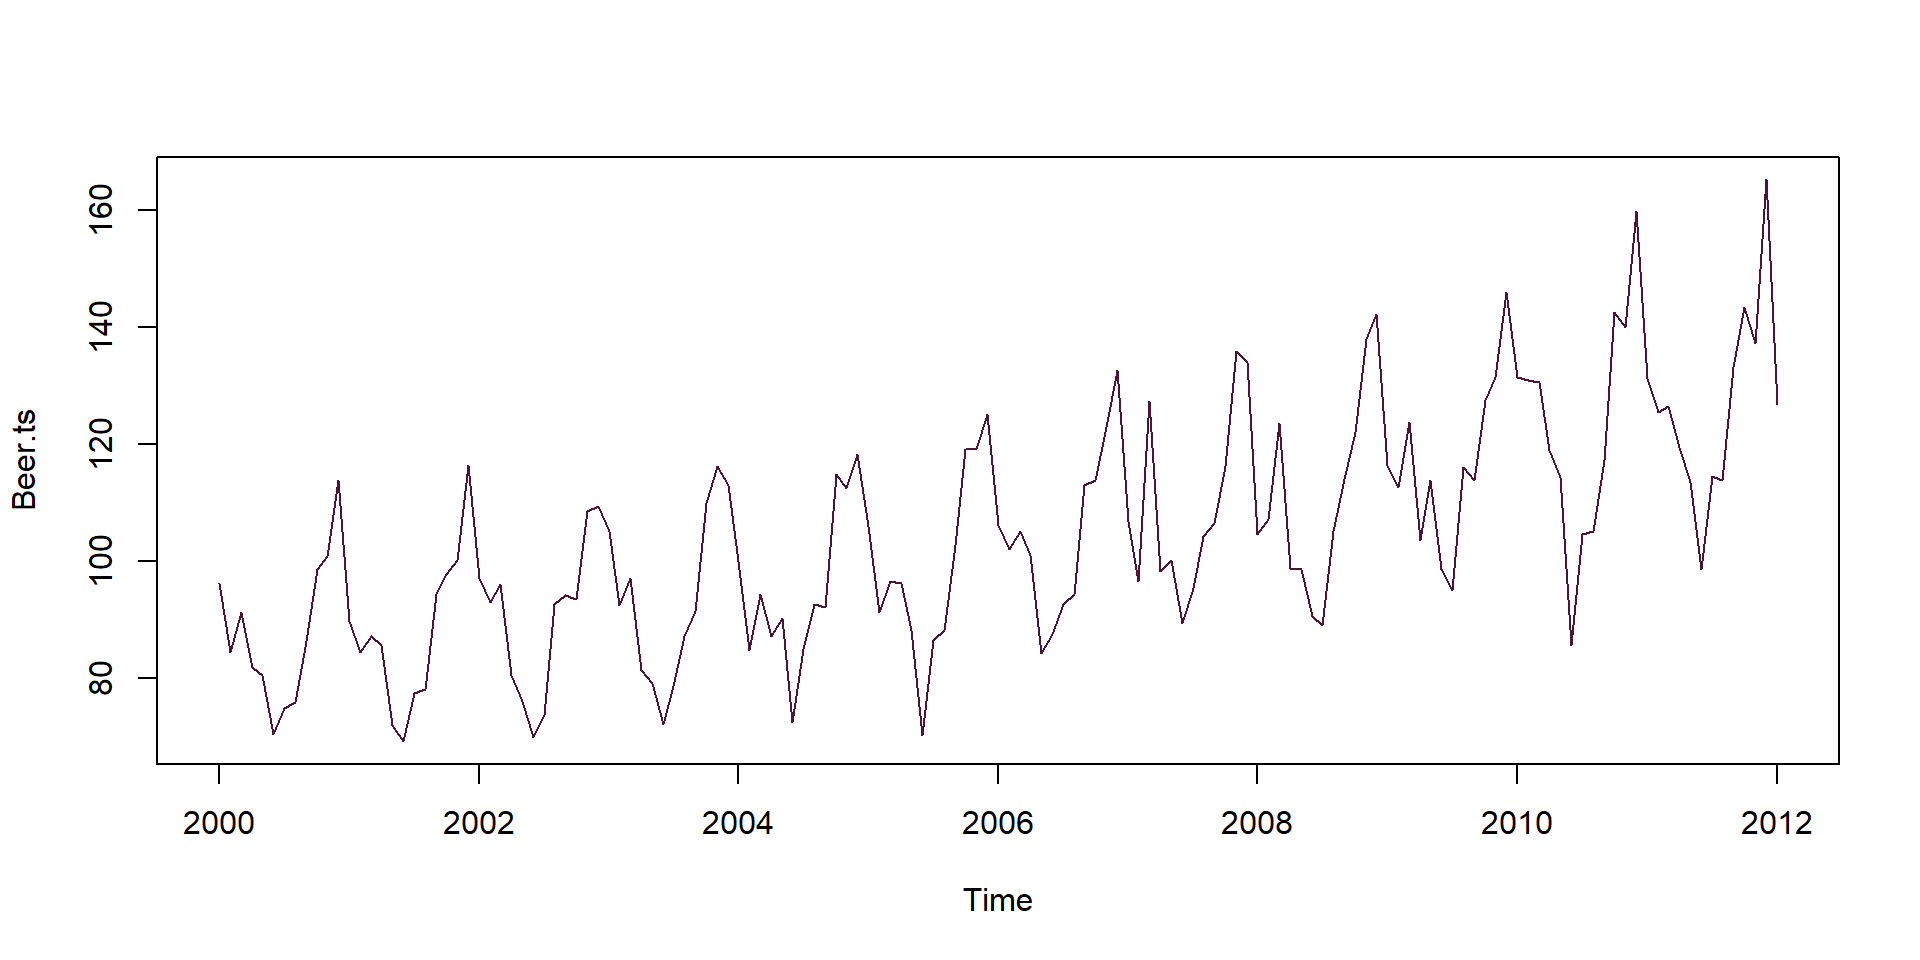
- In this second graph, we look at the units of beer sold at a given location between the years 2000 and 2012.
- It can be seen that there is also an increasing trend and a cyclical pattern every 12 months.
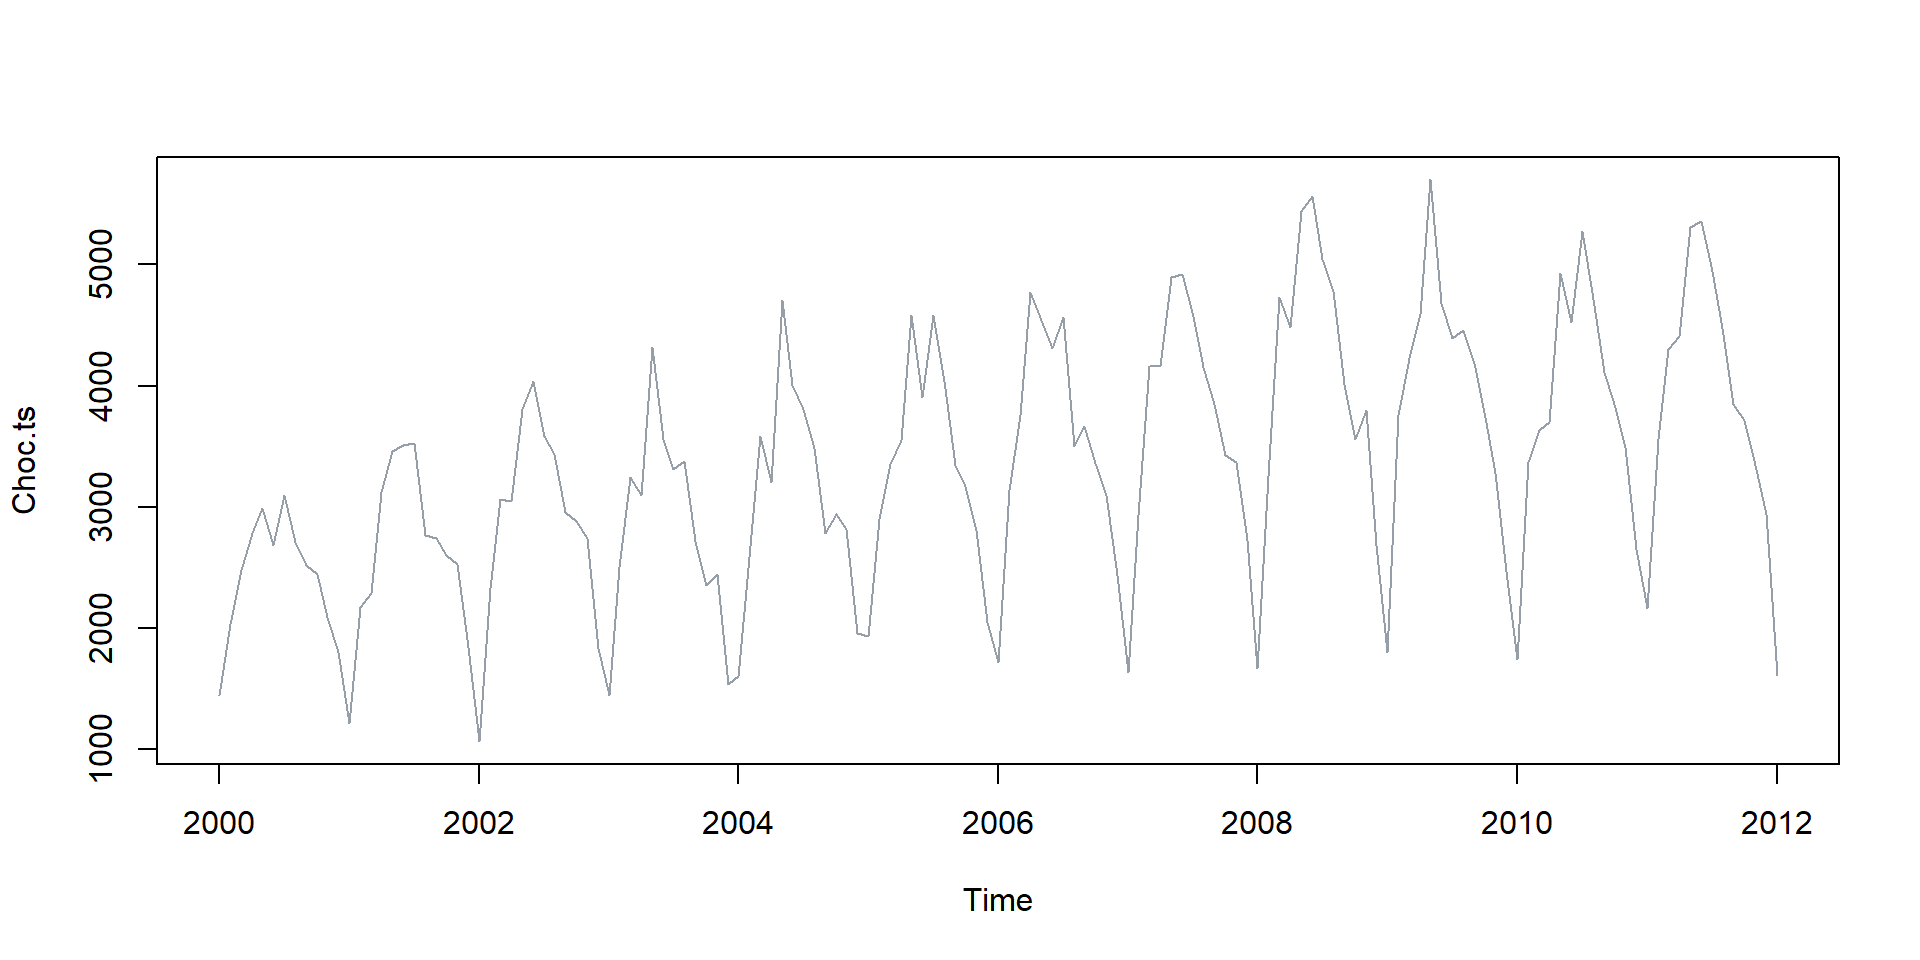
- In this last graph, we study chocolate sales in a given location between 2000 and 2012.
- As in the previous examples, there is an upward trend and an annual cyclical behavior.